

10/08/2026
A widely shared infographic comparing the European Union and the United States across twelve social indicators is a good occasion to look at just how differently two wealthy, democratic blocs can turn out. The rules a society writes for itself shape the lives its people actually lead, these numbers make that concrete.
The figures below come from Eurostat, the U.S. Census Bureau, the World Bank/UNODC, World Prison Brief, the OECD, UNICEF and the CDC.
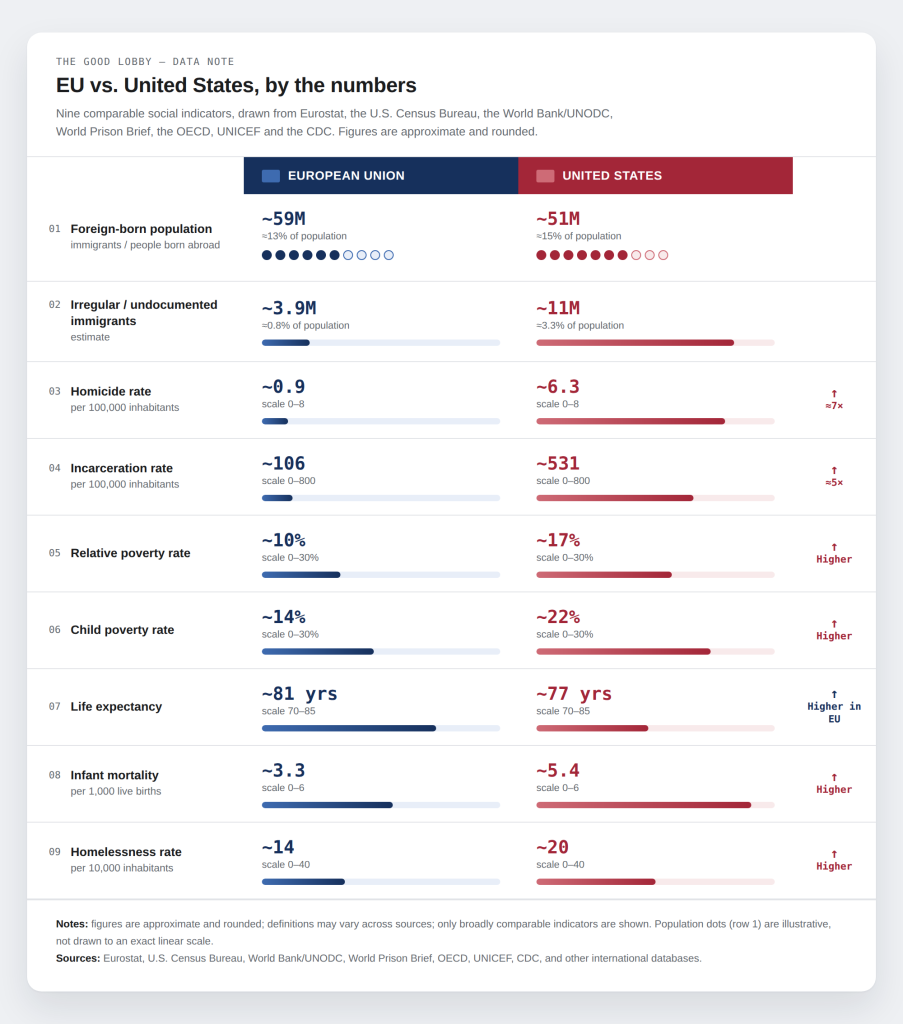
Migration: The EU counts roughly 59 million foreign-born residents (about 13% of its population); the US counts about 51 million (about 15%). On irregular migration, the estimates diverge more: roughly 3.9 million people (~0.8%) in the EU versus roughly 11 million (~3.3%) in the US.
Safety and justice: The homicide rate in the US (~6.3 per 100,000) is about seven times the EU’s (~0.9). Incarceration tells a similar story: the US locks up people at roughly five times the EU rate (531 vs. 106 per 100,000).
Poverty: Both relative poverty (17% vs. 10%) and child poverty (22% vs. 14%) run notably higher in the US than in the EU.
Health and housing: Life expectancy is higher in the EU (~81 years vs. ~77). Infant mortality is lower (~3.3 vs. ~5.4 per 1,000 births), as is the estimated homelessness rate (~14 vs. ~20 per 10,000).
Guns, drugs and schools: This is where the numbers get hard to look away from. Firearm deaths in the US (~13.7 per 100,000) run about nine times the EU rate (~1.6). Overdose deaths are roughly sixteen times higher (~32 vs. ~2 per 100,000). And while school shootings remain rare to nearly nonexistent across the EU, the US records dozens of incidents with victims every year.
Why this matters
This isn’t a scoreboard, and treating it like one would miss the point. These figures are aggregated and rounded, definitions of “poverty” or “irregular migration” differ from one dataset to the next, and averages flatten enormous internal variation – some EU member states report homicide or poverty rates far above the bloc’s average, and some US states look considerably more “European” than others on every one of these measures. Correlation isn’t causation, and no single chart can untangle how much of this gap comes from healthcare systems, welfare design, gun regulation, criminal justice policy, or history. But the comparison does make one thing hard to argue with: policy design isn’t incidental. It’s decisive. Universal healthcare, social safety nets, firearm regulation and criminal justice choices. They show up years later in the mortality tables. Which is the case for civic advocacy, really. The organisations, campaigners and citizens who push for better-designed policy – and who hold lobbying and decision-making open to scrutiny – are, in a very literal sense, working on the gap between these two columns.